



Insights and statistics: from the menu to the dining room
Assaggio and Osteria: a snapshot of the last 7 days. Bistro: trends, top dishes, languages, and the new data from public pages (menu searches, allergen filters, QR sources). Ristorante: AI brief, dish matrix, view→order conversion (with the orders add-on), booking channels, event funnel, and the dining room (occupancy, revenue per seat hour, waitlist). Insegna and Insegna Plus: customer segments, 14-day forecasts, comparisons. All anonymous and cookie-free.
In brief
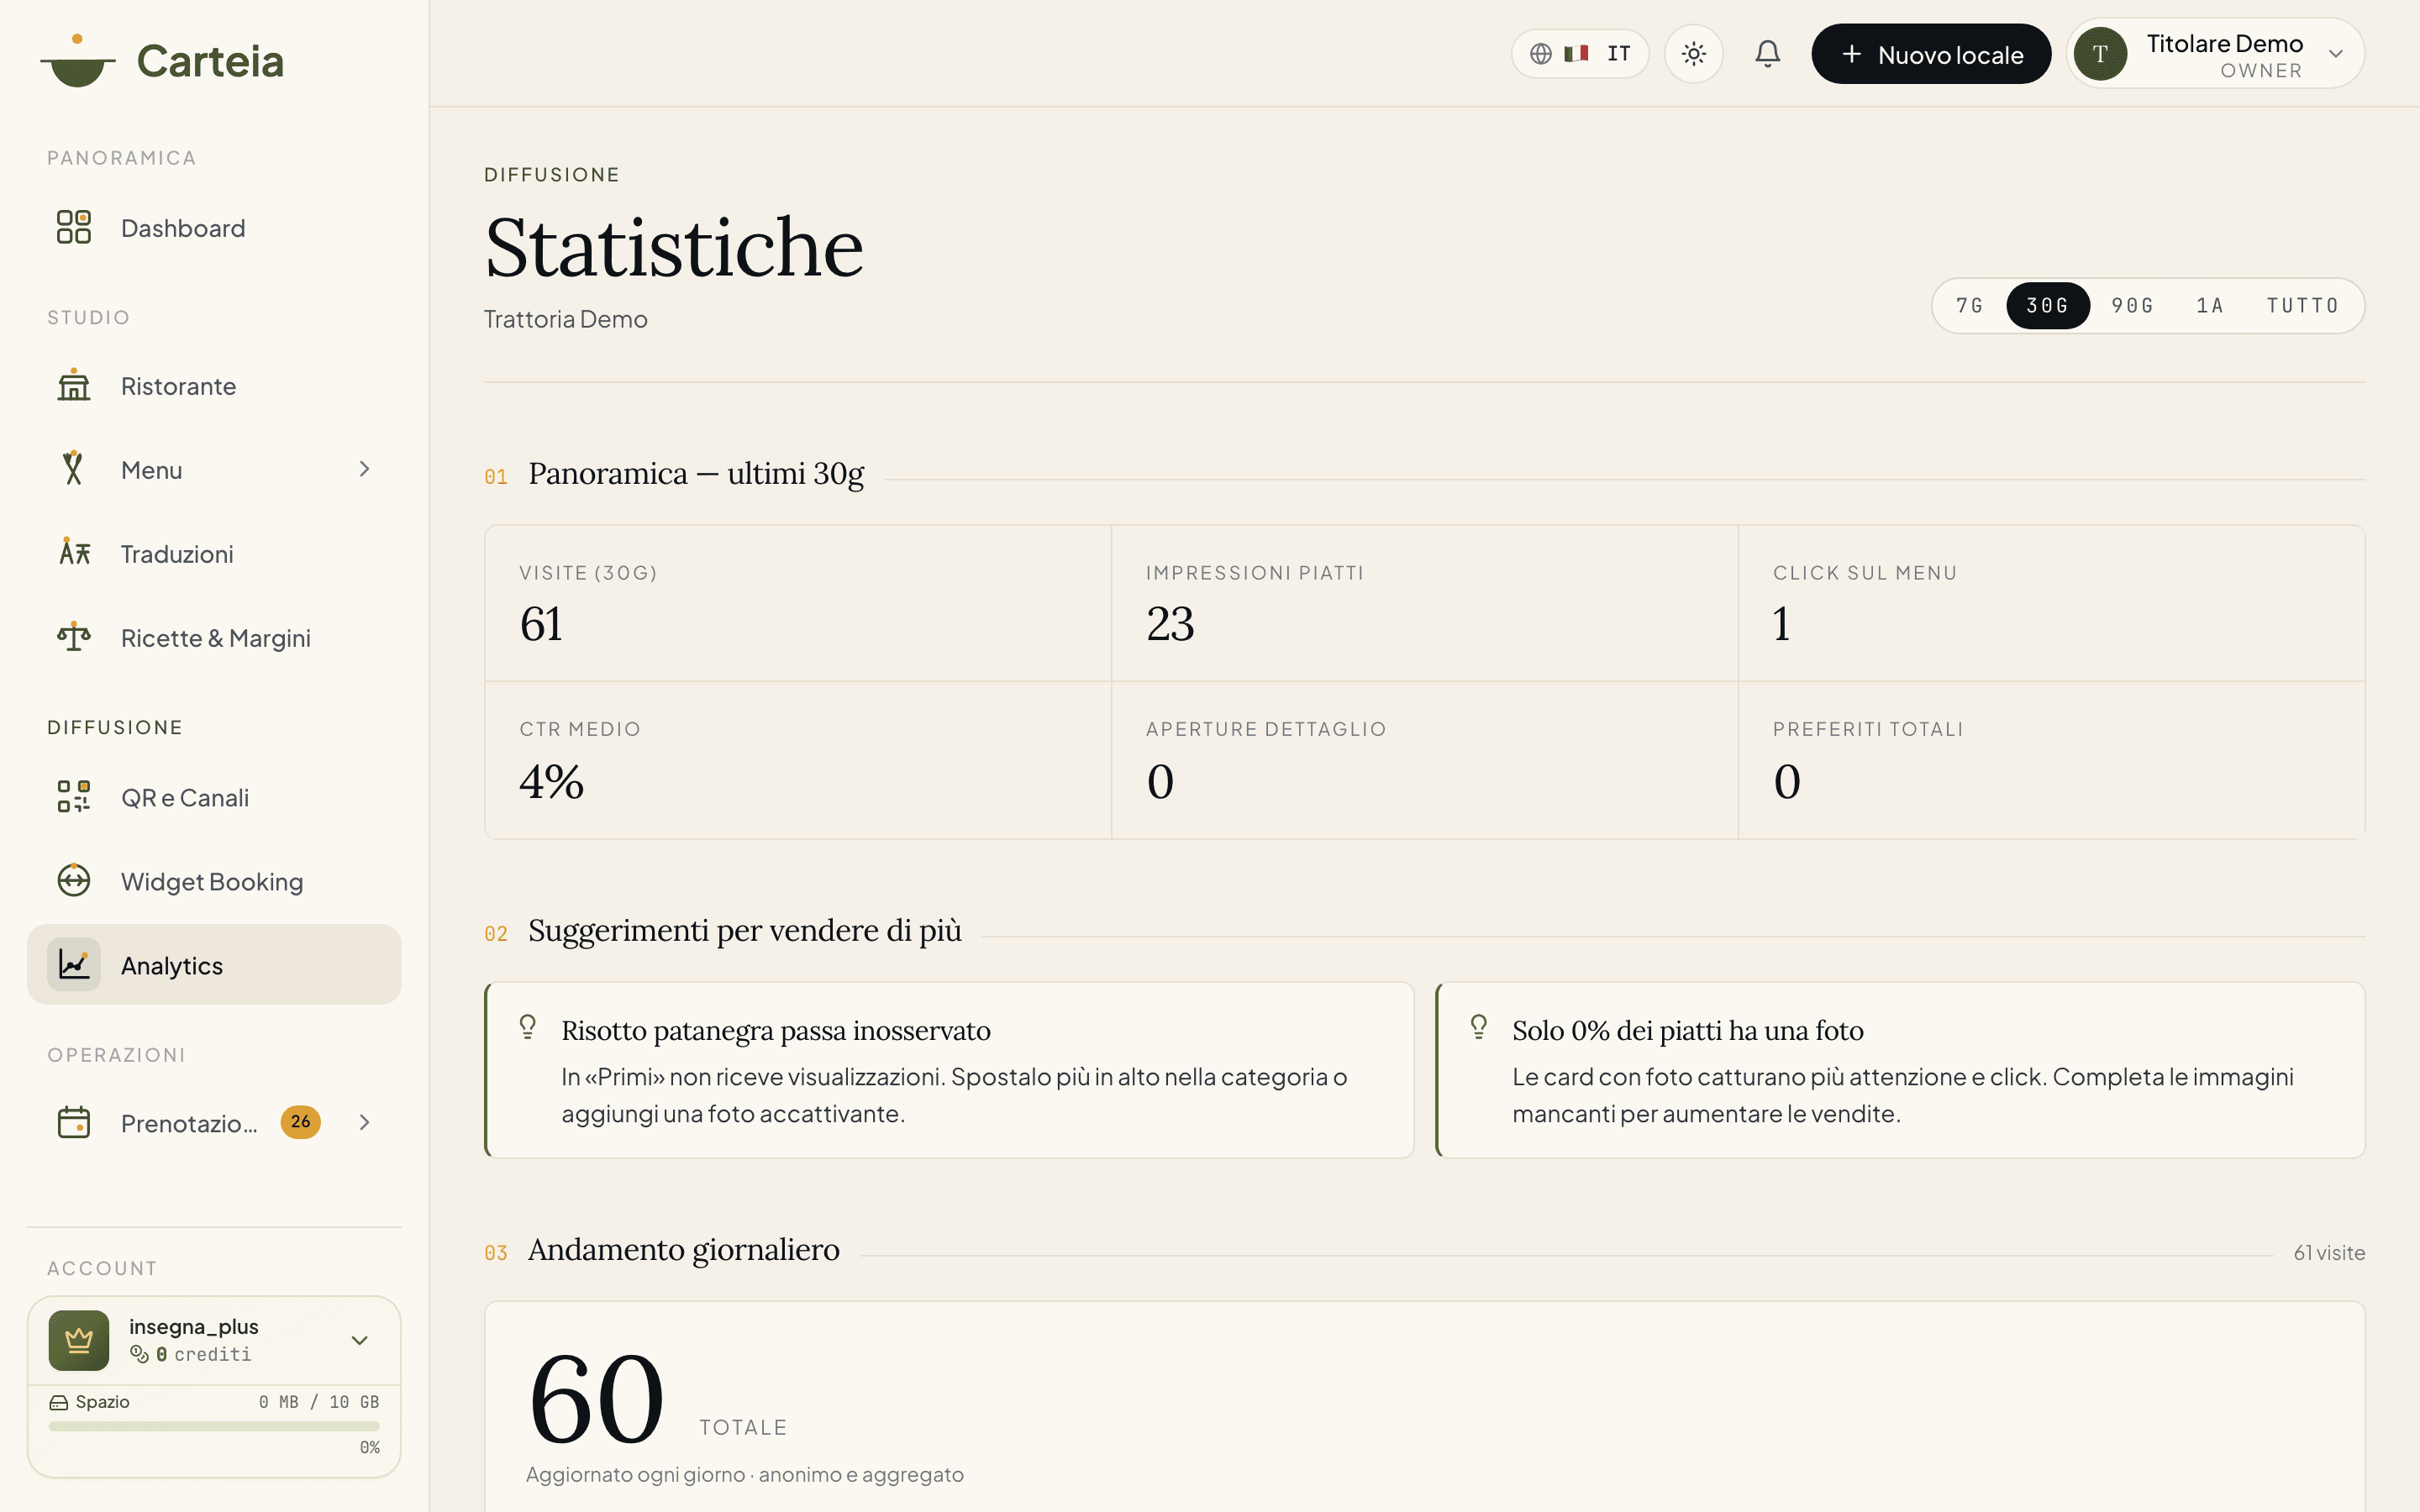
The Statistics page (/dashboard/analytics) is where you understand, with numbers in hand, what is happening in your venue: how many people open the menu, which dishes they look at and which they actually order, where bookings come from, and how much each seat in the dining room earns. The higher your plan, the finer the reading becomes — all the way to forecasts for the coming days.
We tell the story of every statistic in two ways: a quick reading for those who have two minutes in the kitchen, and a deeper reading for those who like to reason about numbers. You do not need to be a data expert: we tell you what to look at and what to do with it.
Everything is anonymous and aggregated: no cookies in the public menu, no consent to see your own data in the dashboard.
What is measured
When someone opens your page or your menu, Carteia records an anonymous event: which page they opened, in which language, where they came from. From here come the numbers you see:
- Visits — how many times the menu was opened.
- Impressions — how many times dishes appeared before the customer's eyes.
- Clicks — how many times a dish was tapped to open it.
- Detail views and favorites — genuine interest in a dish.
From the Bistro plan onward, signals from the public pages also come into play (what customers search for, which filters they use, which QR they arrive from) and, from Ristorante, the data generated by service (table orders, sittings in the dining room, bookings, event requests). Robots and scrapers are filtered out, so your numbers stay clean.
What you see, plan by plan
Basic snapshot — Assaggio and Osteria
On Assaggio and Osteria you see a snapshot of the last 7 days with the 3 numbers that matter: menu visits, dishes viewed, clicks. It helps you understand whether it is worth moving up to a plan that unlocks everything else. You see the other sections as a preview, with an invitation to unlock them.
Full statistics — from Bistro
From Bistro, the menu's operational panel opens up:
- Period of your choice: 7, 30, 90, 365 days, or all.
- Comparison with the previous period: every number tells you whether you are growing or declining.
- Day-by-day trend of visits, with a chart.
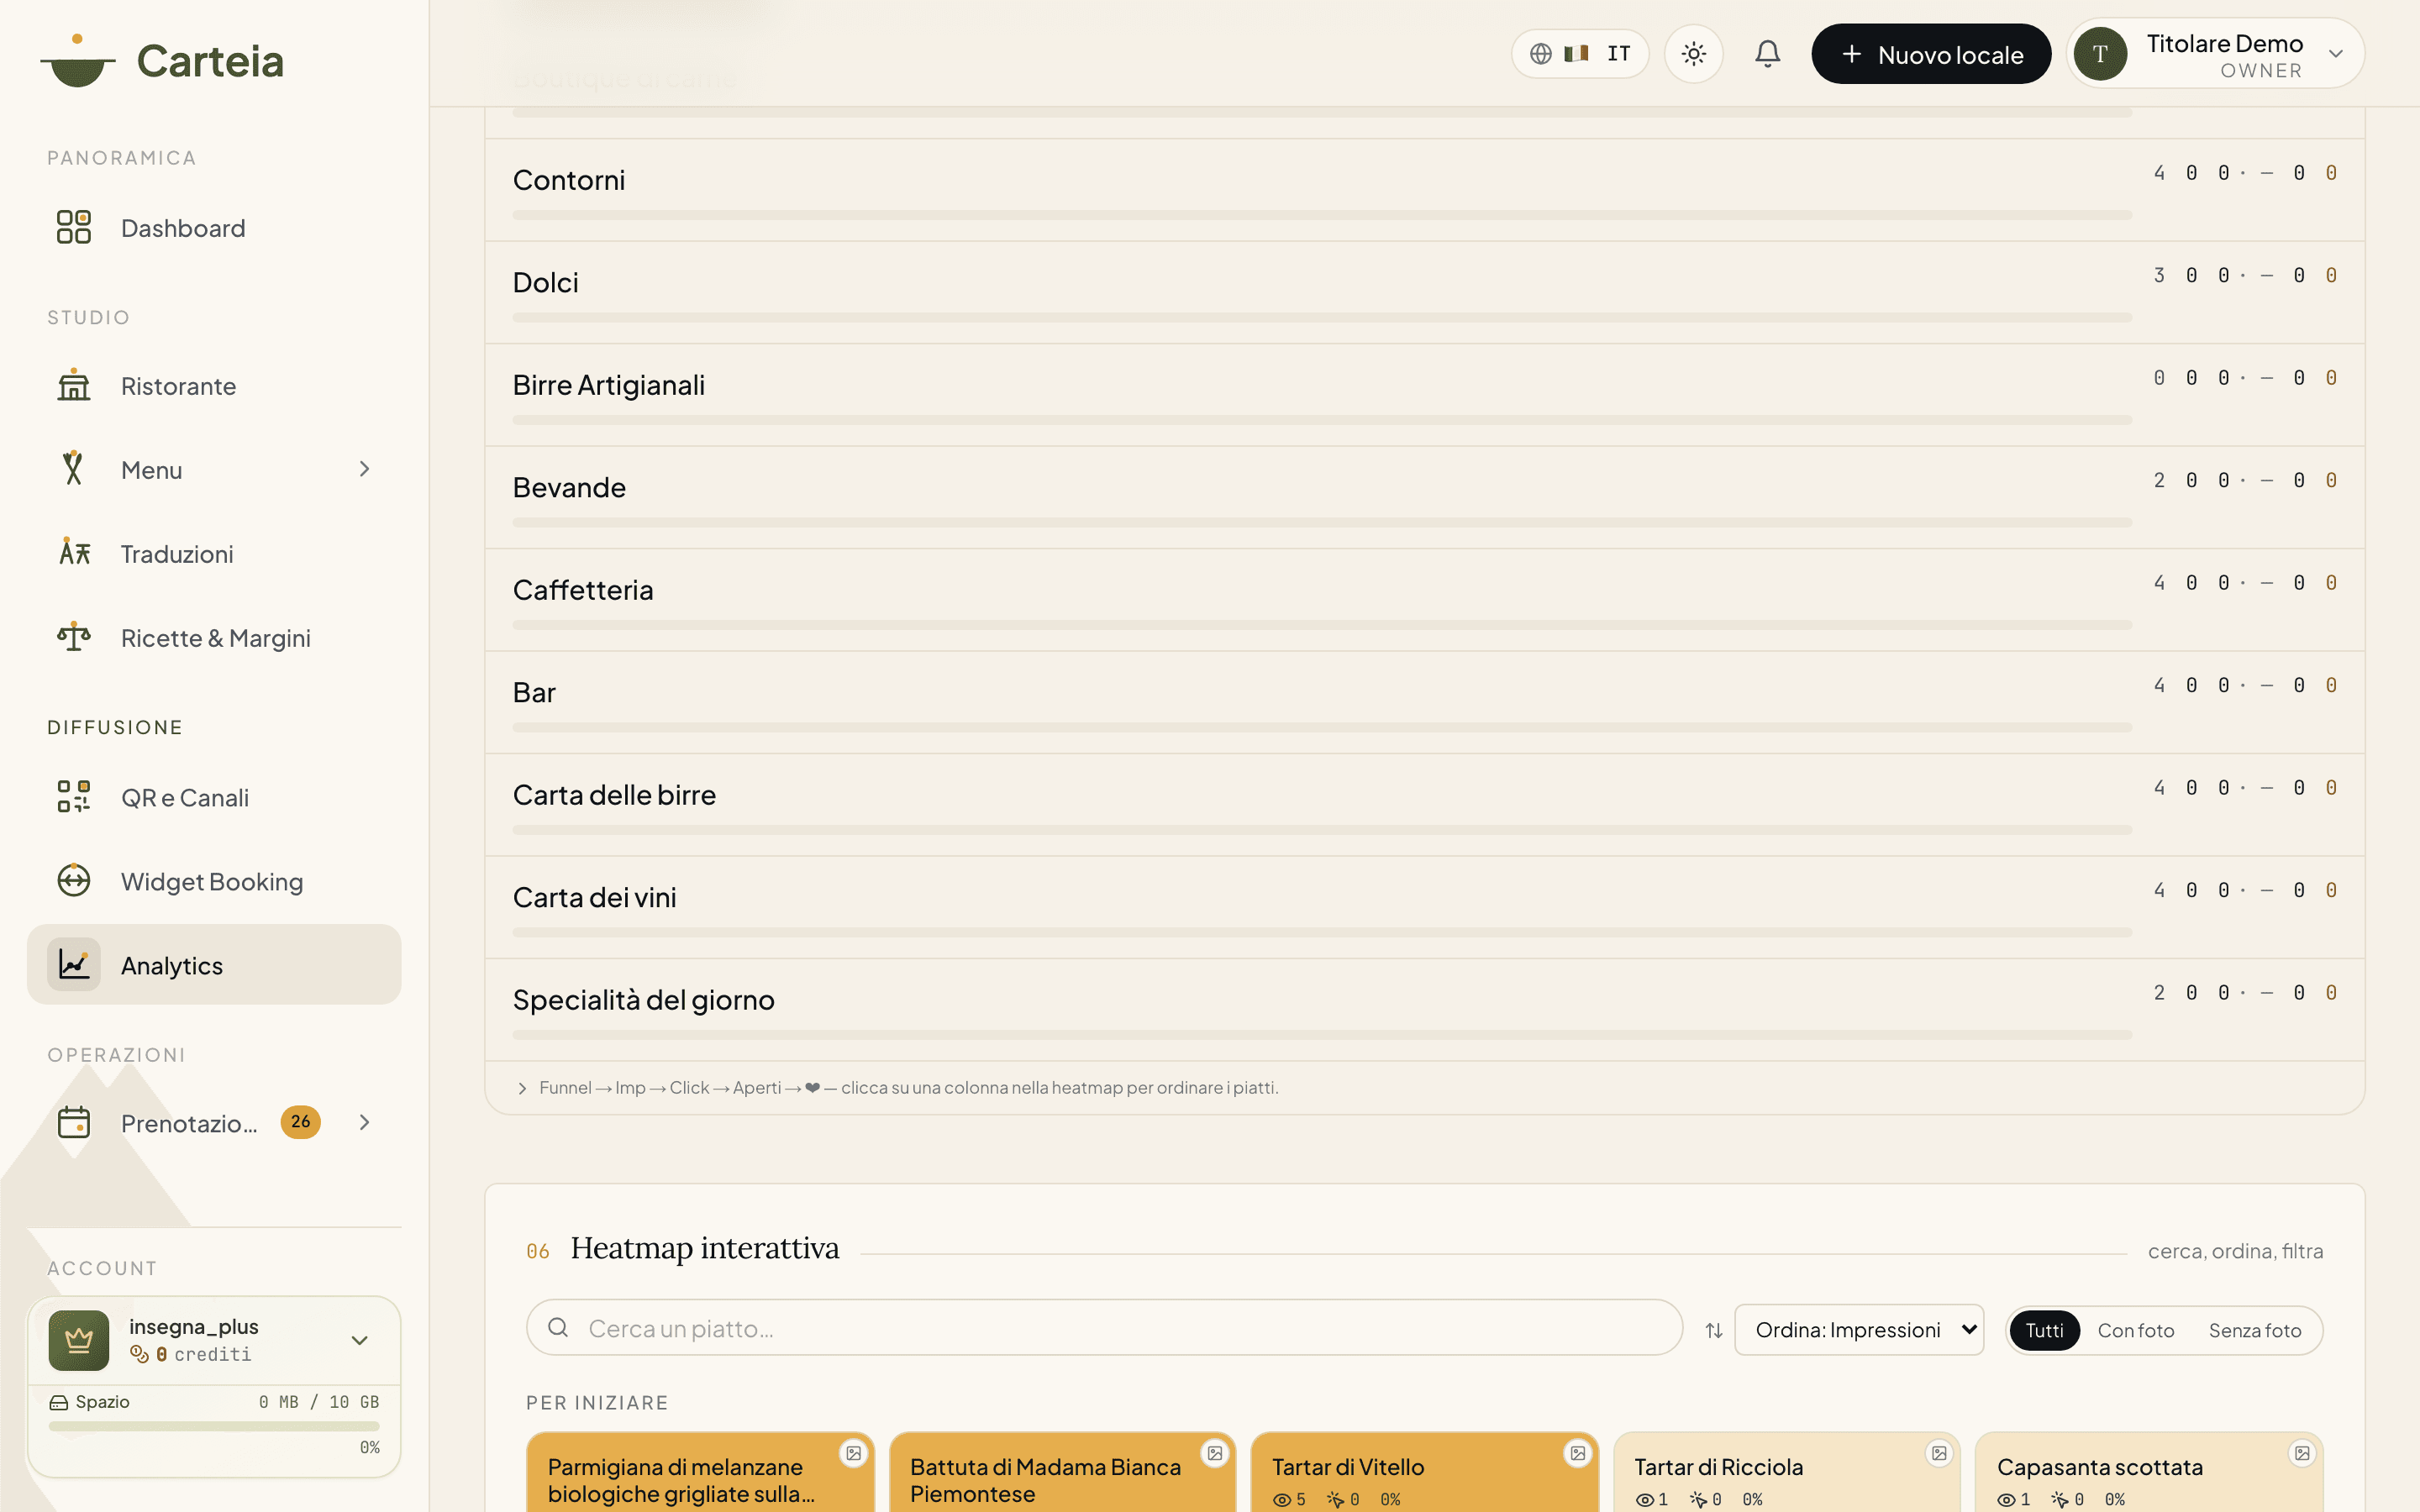
- Top dishes by clicks, views, and favorites.
- Customer languages, as a percentage: it tells you if you have more tourists than you think.
- Automatic suggestions (e.g. "this dish is viewed a lot but clicked little: change the photo").
- Menu operational health: a score on photos, descriptions, allergens, and hours, with the actions to improve it.
Menu searches: what customers look for (even what they do not find)
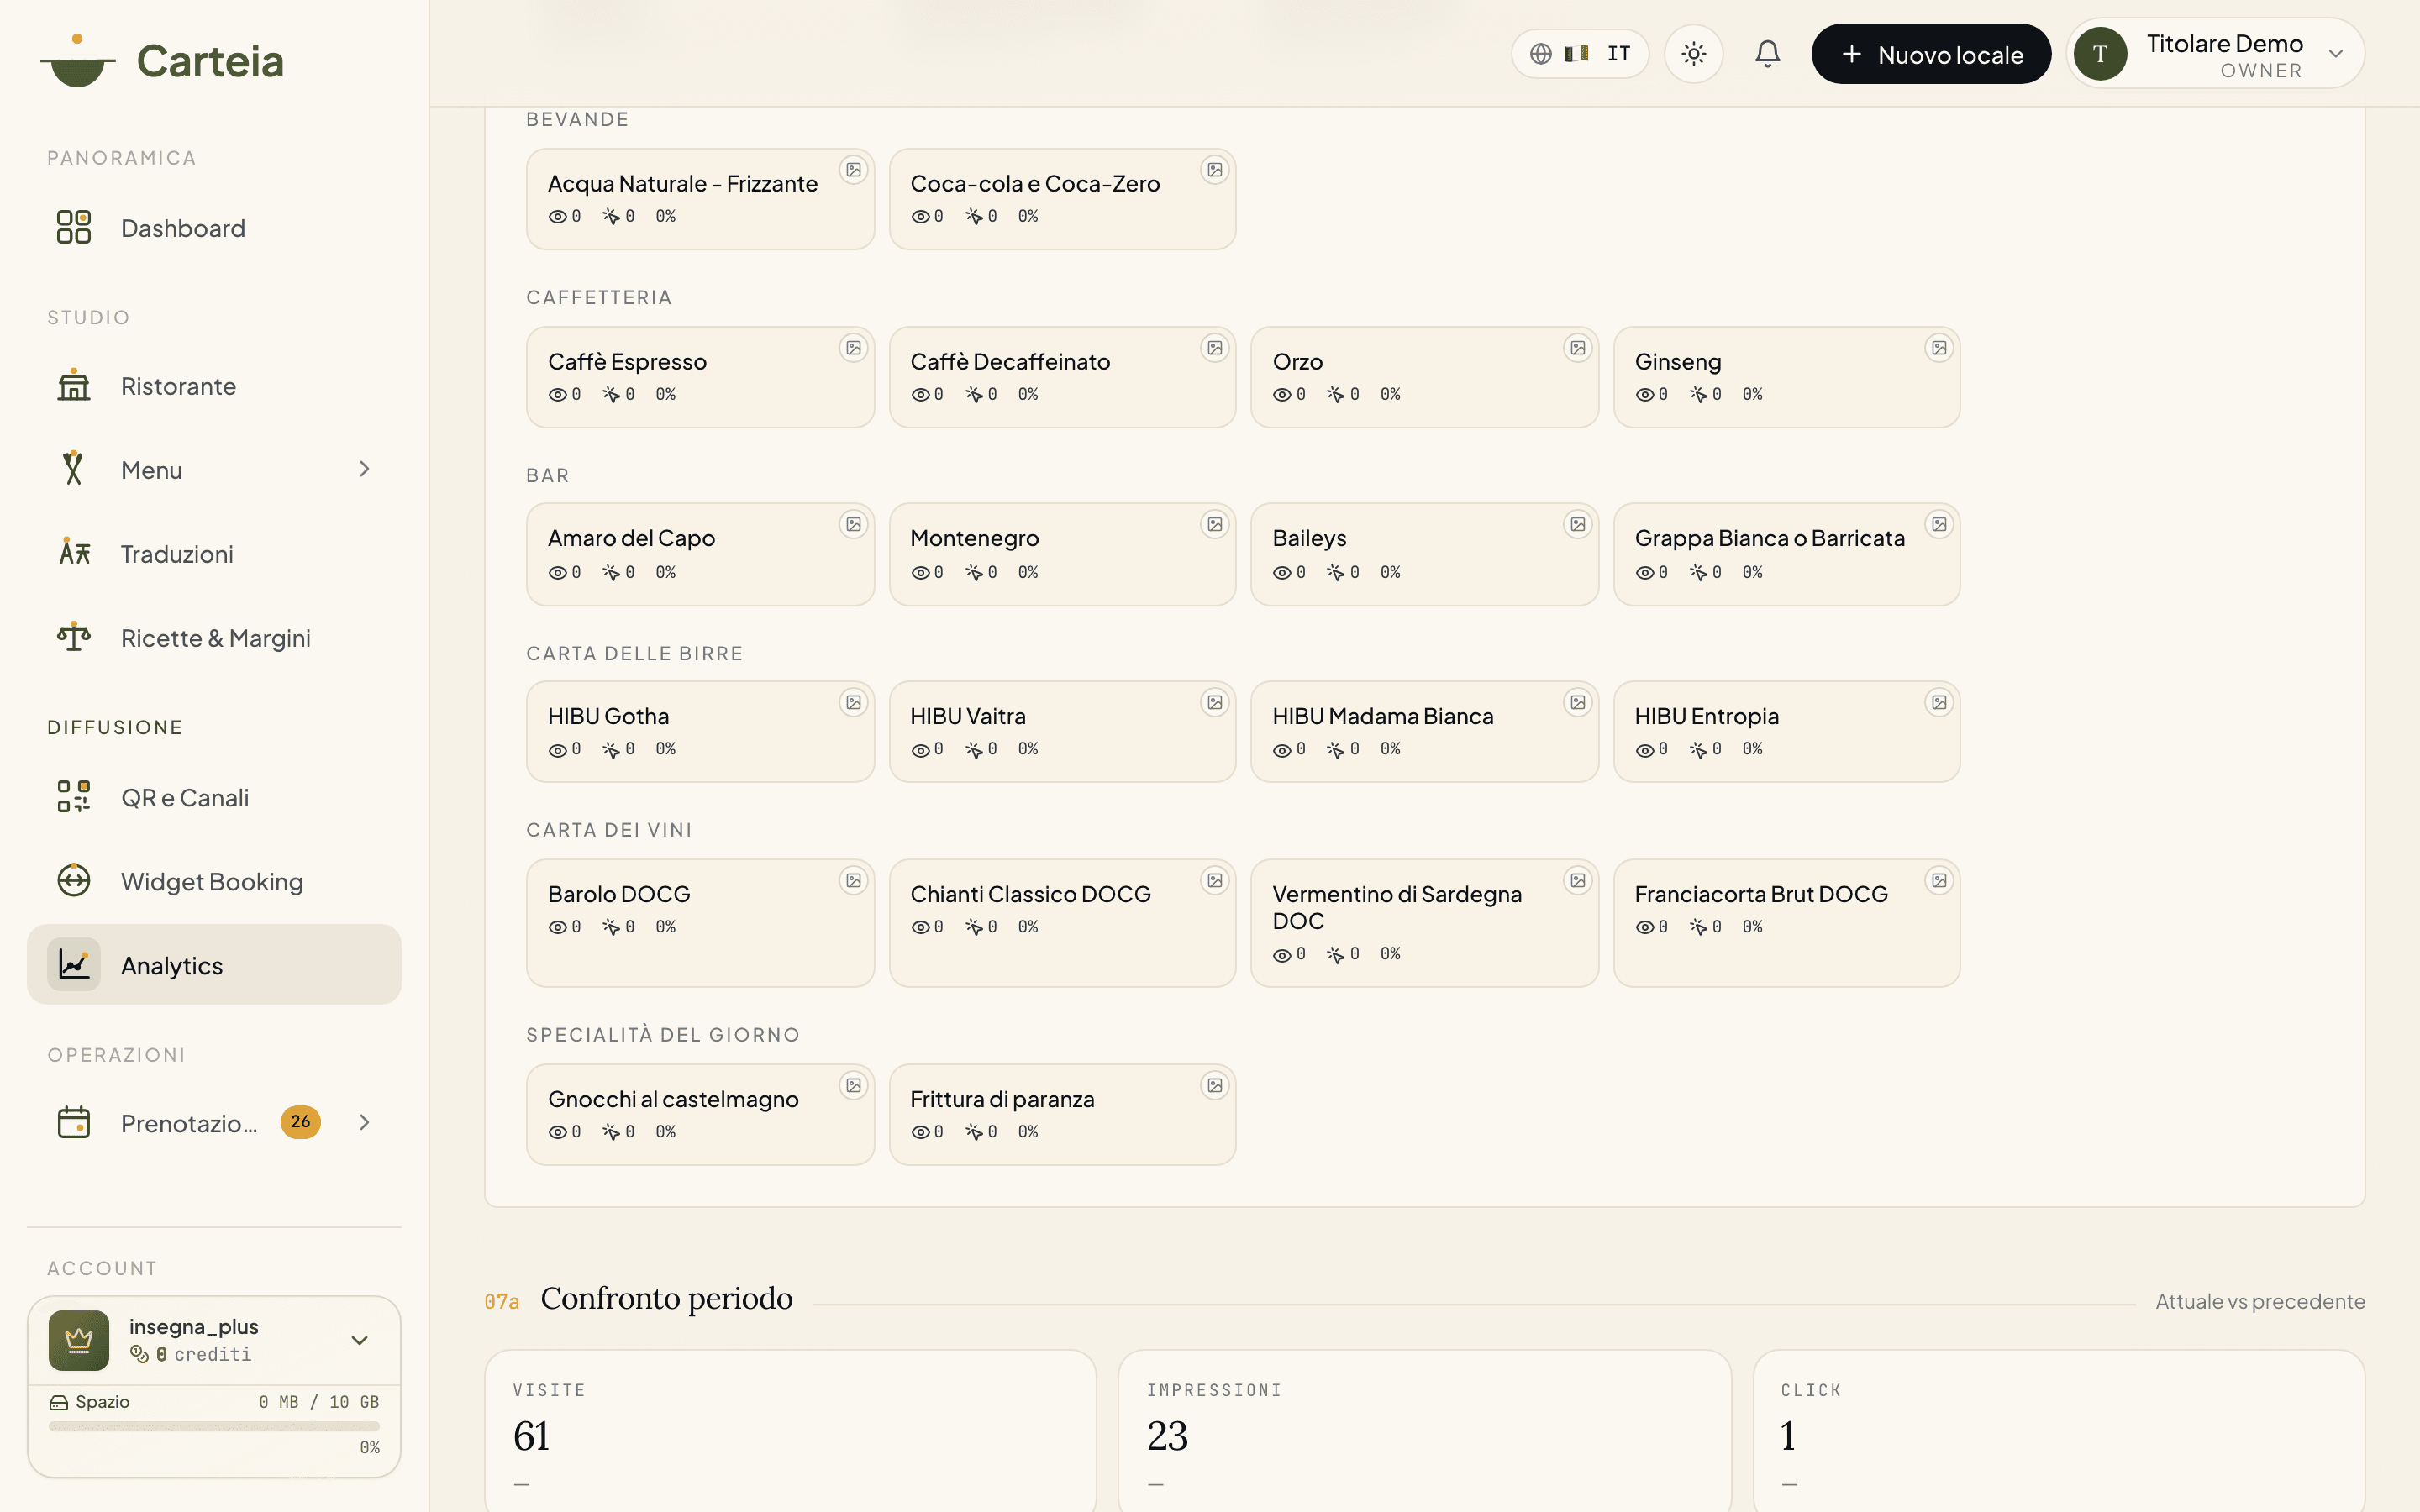
When a customer uses the search bar of your public menu, we record what they typed. Two lists come from this: the most searched and — the most valuable part — unmet demand, that is, the searches that found nothing.
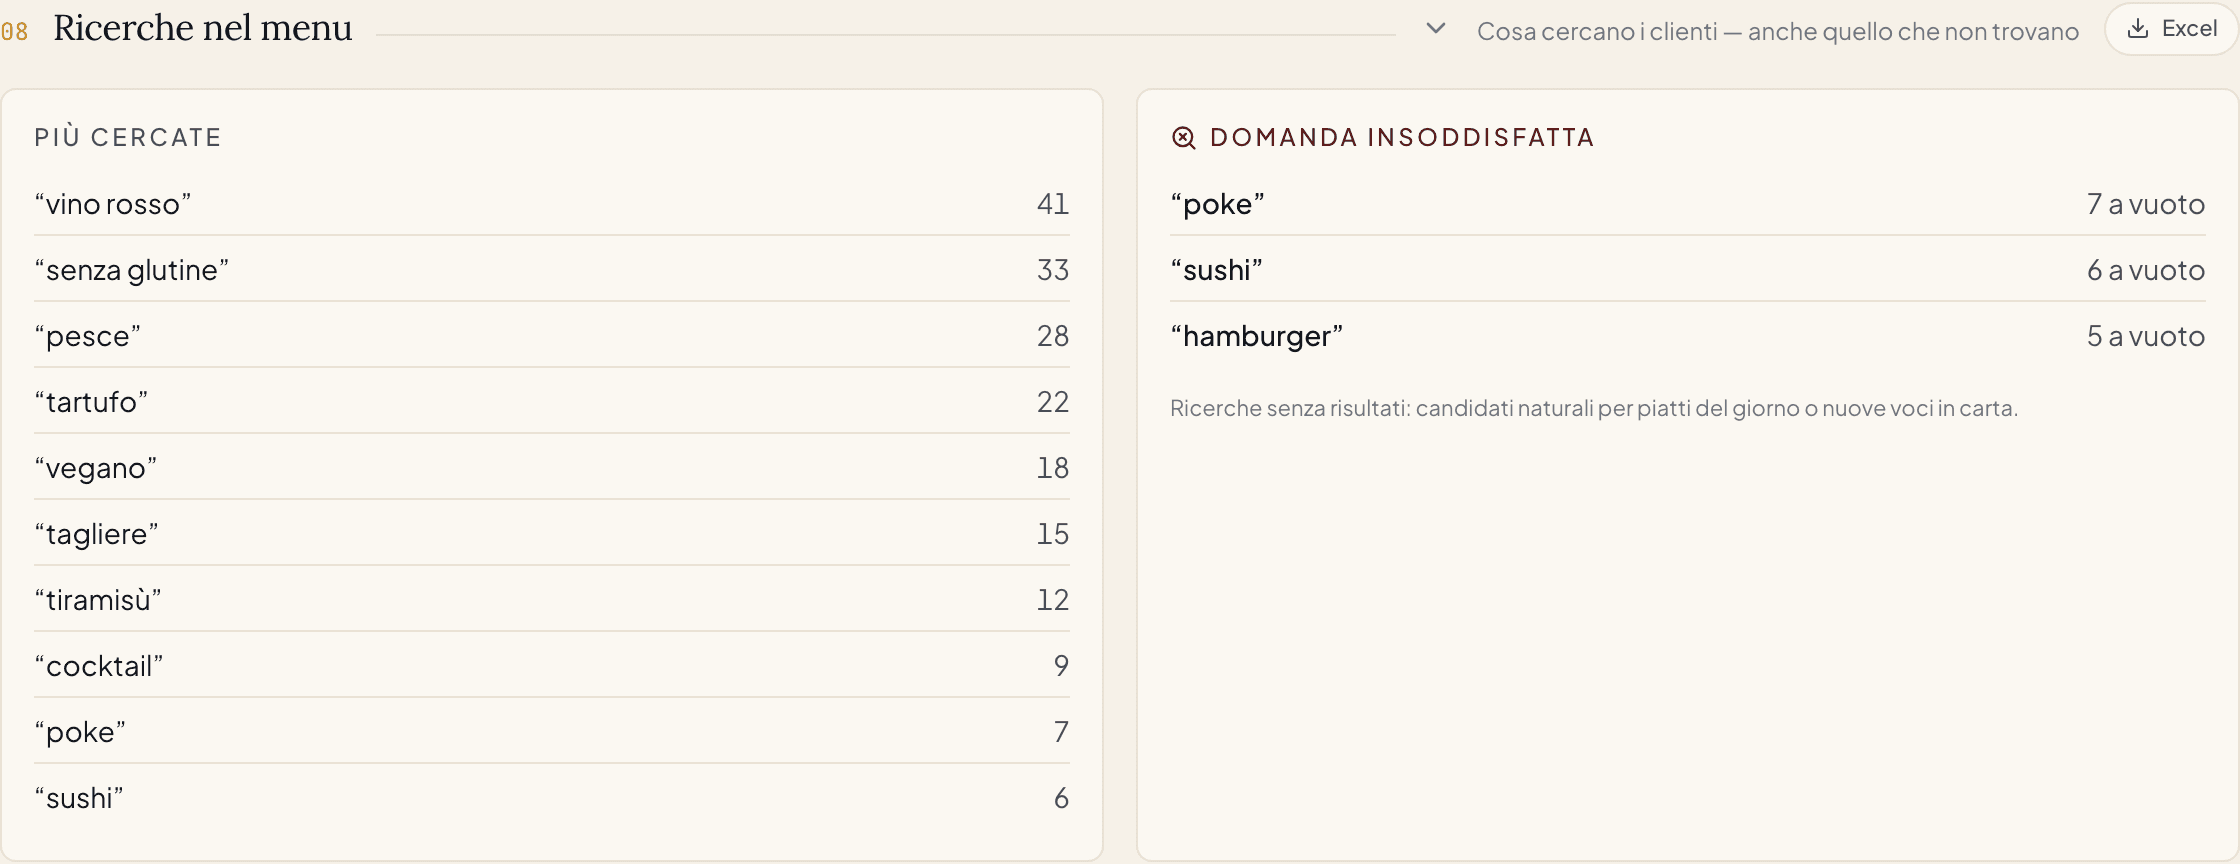
It is the only data point in which the customer explicitly states what they want. Available from Bistro onward.
Engagement on the public menu: filters, languages, and QR sources
Three counters that tell how customers use the menu:
- Allergen filters most activated (for example "gluten", "lactose").
- Language switches: which languages customers shift the menu to.
- QR sources: which physical material the scans come from (table, window, flyer, receipt, social…).
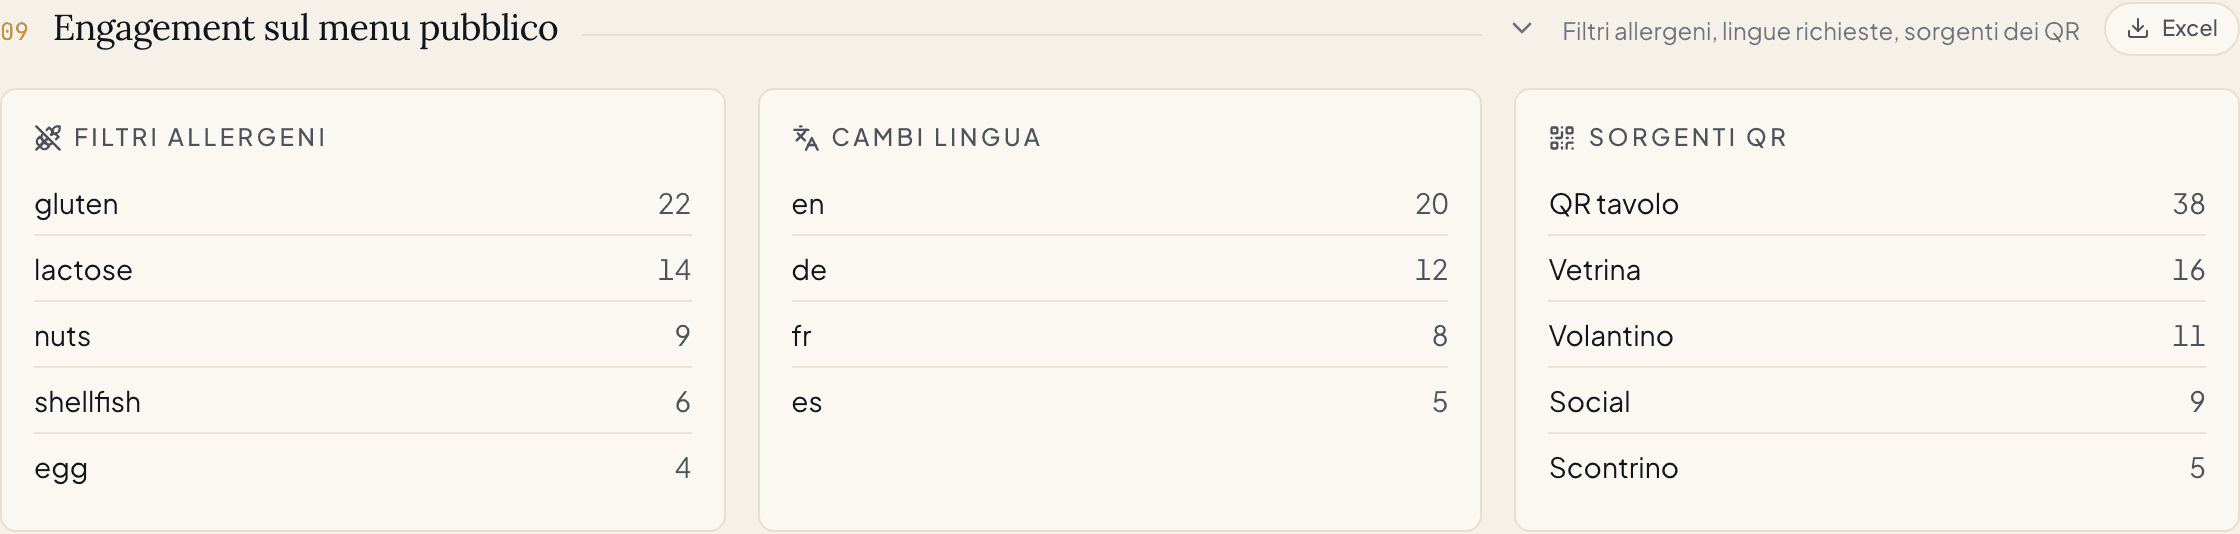
Available from Bistro onward. The source of each QR is set in the QR studio and is available on all plans.
Advanced insights — from Ristorante
Everything in Bistro, plus tools for real management.
Weekly AI brief Senza costo aggiuntivo
A summary written by the AI on the real data of your venue: it flags trends, unusual things, and proposes 3 concrete moves. You get 2 free briefs per month; each additional brief costs 5 credits. Those already generated stay there, to reread for free.
When customers arrive (day × hour)
A 7-day × 24-hour grid that shows when scans concentrate: useful for organizing shifts, choosing when to hold an event, or when to launch a promo.
Dish matrix
It places each dish in 4 boxes by cross-referencing popularity (clicks) and margin (from food cost): Star (popular and profitable), Workhorse (popular but low margin), Puzzle (profitable but rarely clicked), Dog (little loved and unprofitable). If you have not yet entered recipes in Food Cost, the matrix uses popularity alone.
From the viewed menu to the sold menu (view → order conversion)
This is the metric that menu engineering was missing: it cross-references, dish by dish, how much a dish is viewed on the digital menu (impressions, clicks, opened cards) with how much it is actually ordered from table orders. It calculates the click → order conversion rate and flags two cases on its own:
- «Viewed, not ordered» — lots of interest, few sales: a problem of price, photo, or description.
- «Sold without a showcase» — it sells even without online visibility: it deserves a better position in the menu.
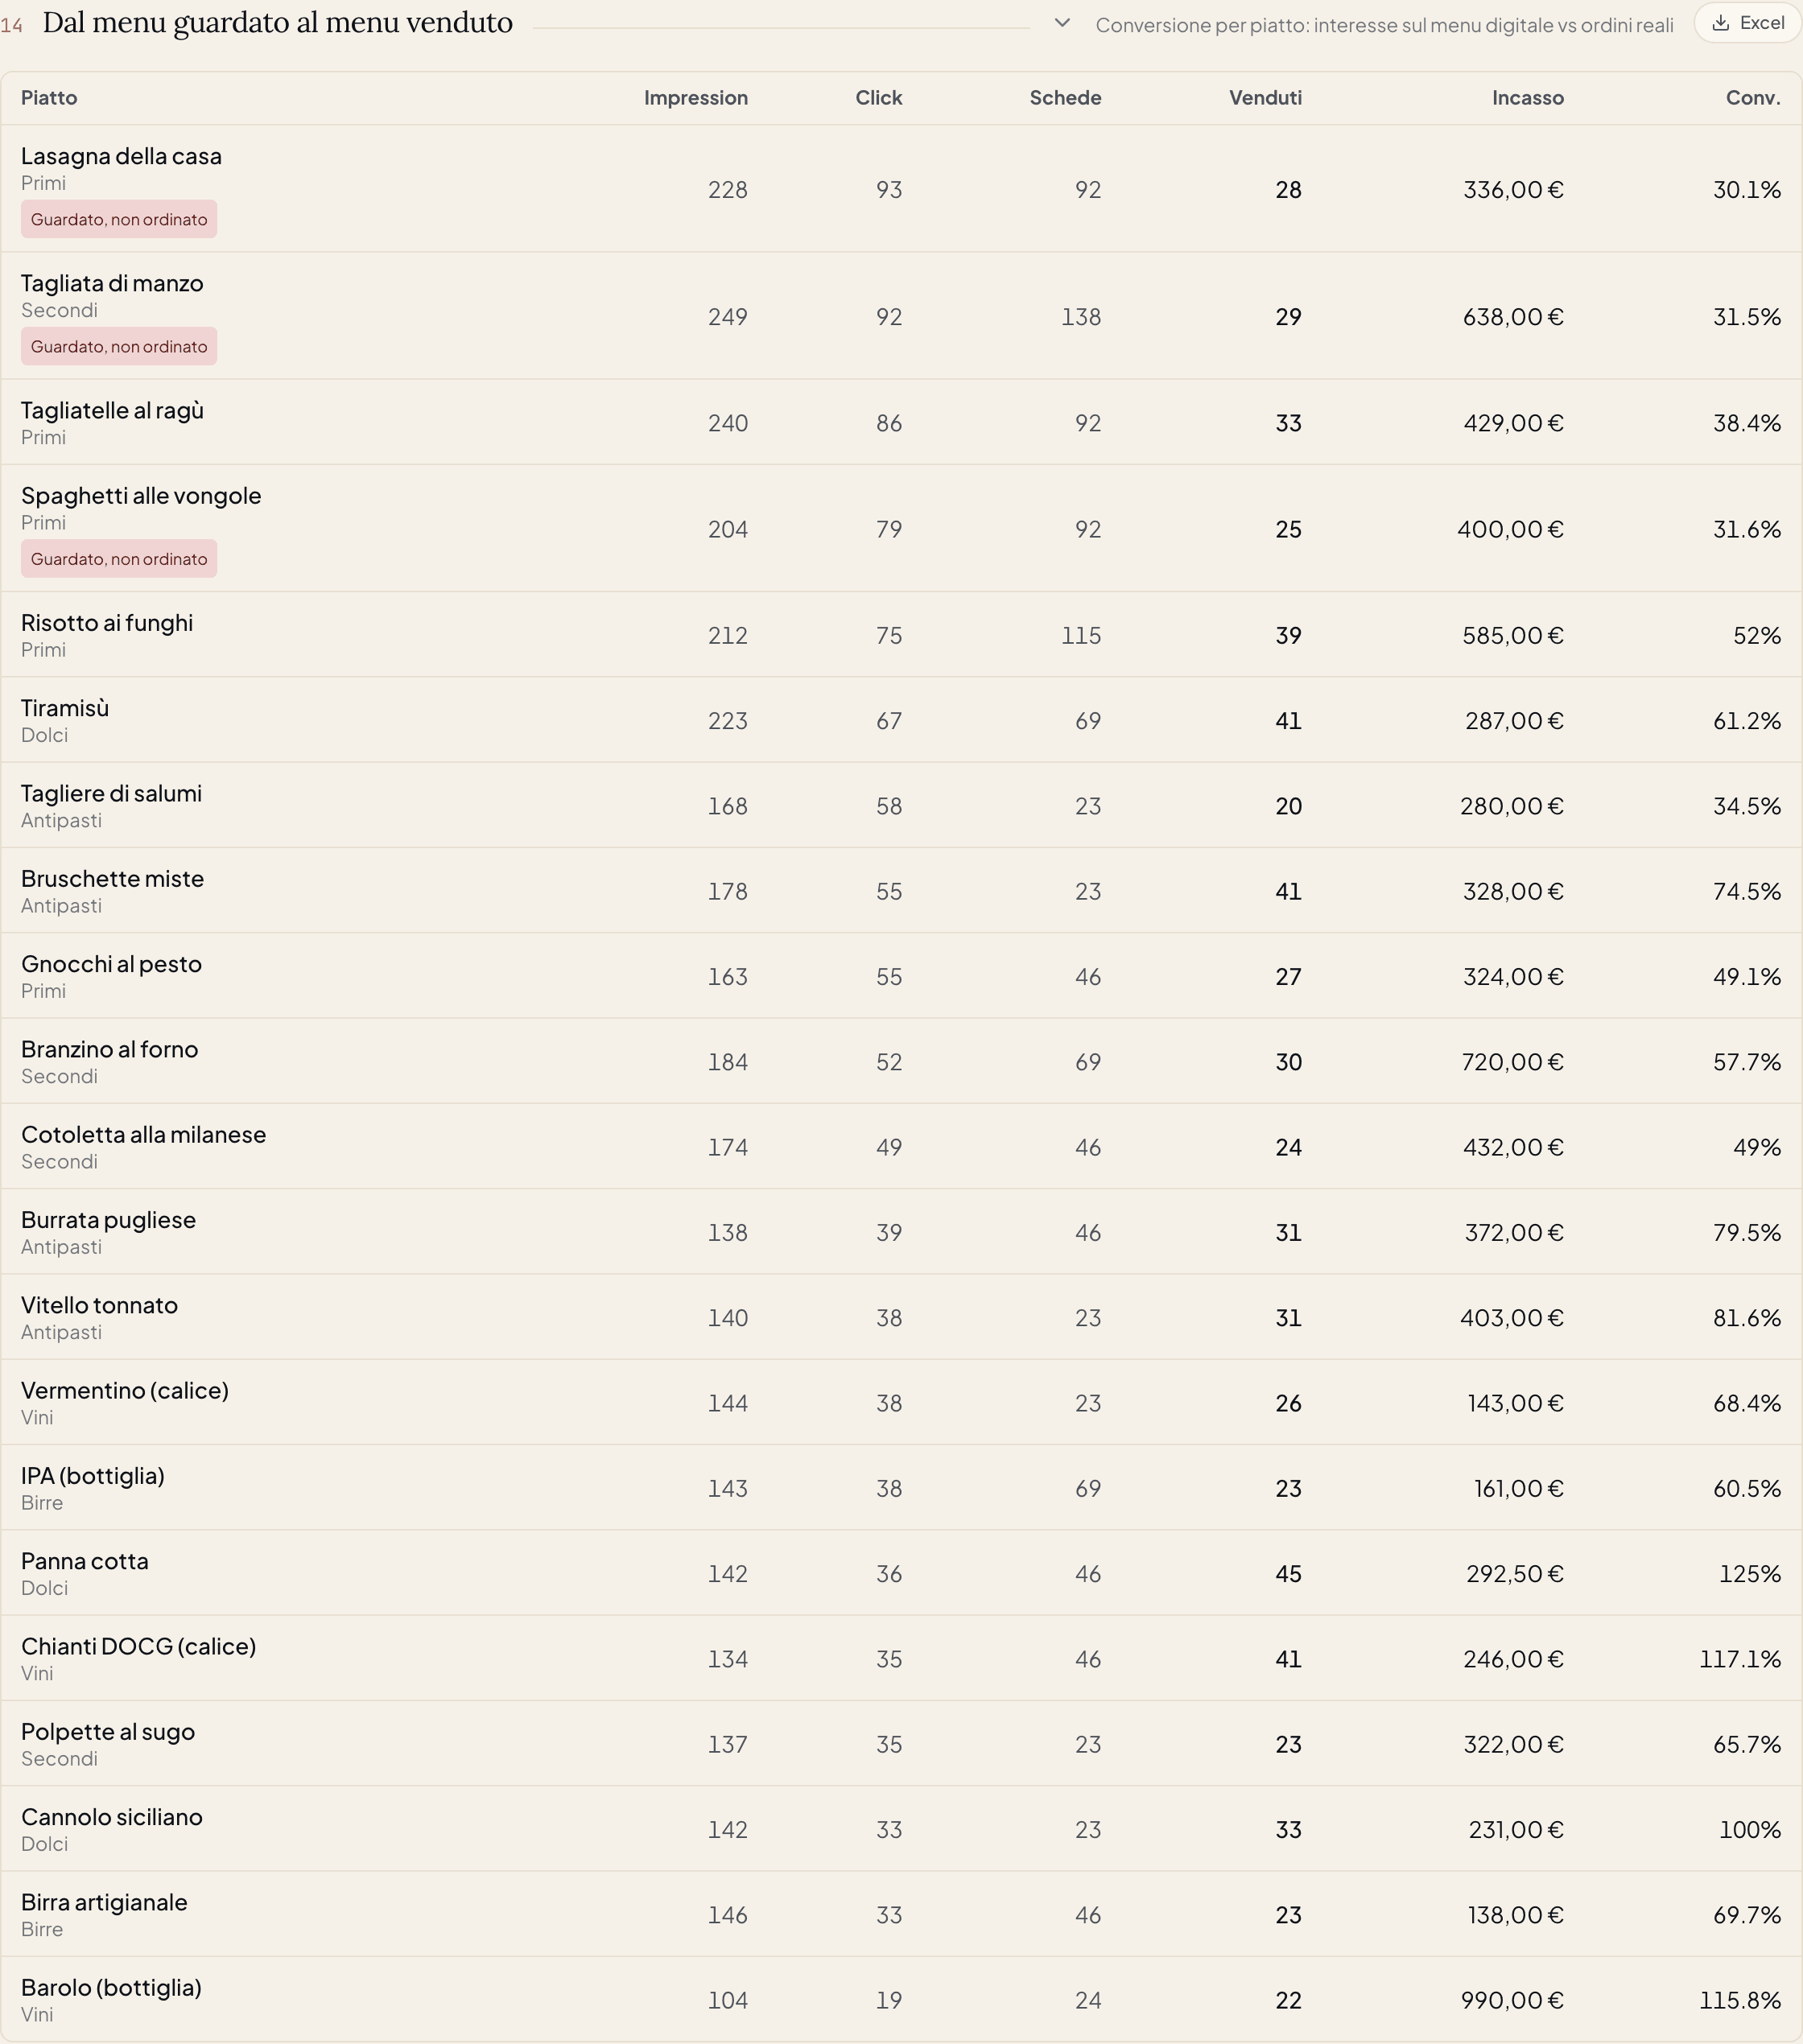
Available from Ristorante onward with the QR table orders add-on active: both sources are needed (menu interest and real sales). The extended order analytics (service times, payment mix, tips, ticket by origin, revenue per table, kitchen load) and the 6-sheet Excel export live in the Analytics page of the orders module.
Most clicked combos
The pairs of dishes opened in the same visit (within 30 minutes). Ideas for a tasting menu or for the server's recommendations.
Booking intelligence
The booking numbers laid bare: confirmation and no-show rate (with a warning if it exceeds 10%), average covers, average lead time, and the fill rate for each time slot set in Rooms and Tables.
Booking channels
Compare the channels bookings come from — Vetrina Carteia, Widget sito (the widget on your website), Inserite a mano, Import — with volumes, outcomes, and no-show rate per channel.

Available from Ristorante onward. The no-show risk score of the individual booking (a badge on the board, with the reasons in the tooltip) lives instead on the Bookings board: see Advanced Booking.
Private events: from contact to contract
It turns event requests (birthdays, corporate events, ceremonies…) into numbers by type: conversion rate, average value of the requests won, lead time of the request, and time to first contact.
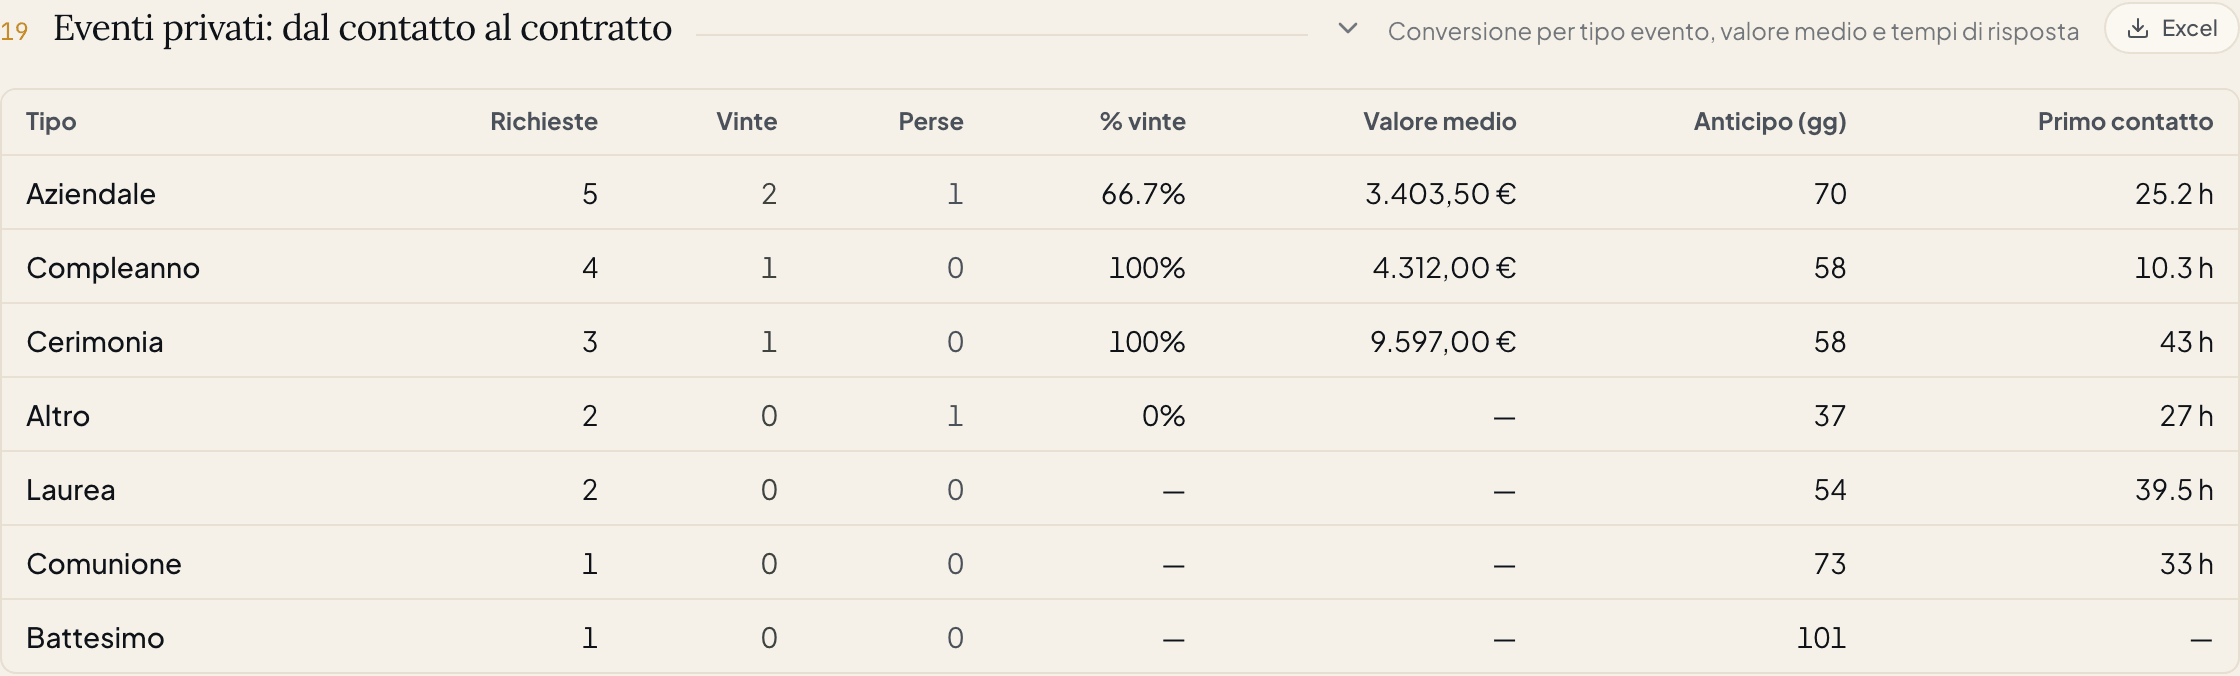
Available from Ristorante onward. To manage requests and quotes, see Events and Event quotes.
Dining room: occupancy, revenue, and waitlist
Three views built on the real sittings from the LIVE table service:
- Occupancy heatmap (day × hour): guests seated, from the real table sessions.
- Turnover per room: sittings, average duration, covers, linked revenue, and revenue per seat hour (how much each seat earns while it is occupied).
- Waitlist KPIs: real wait vs promised, queue→table conversion, lost covers.
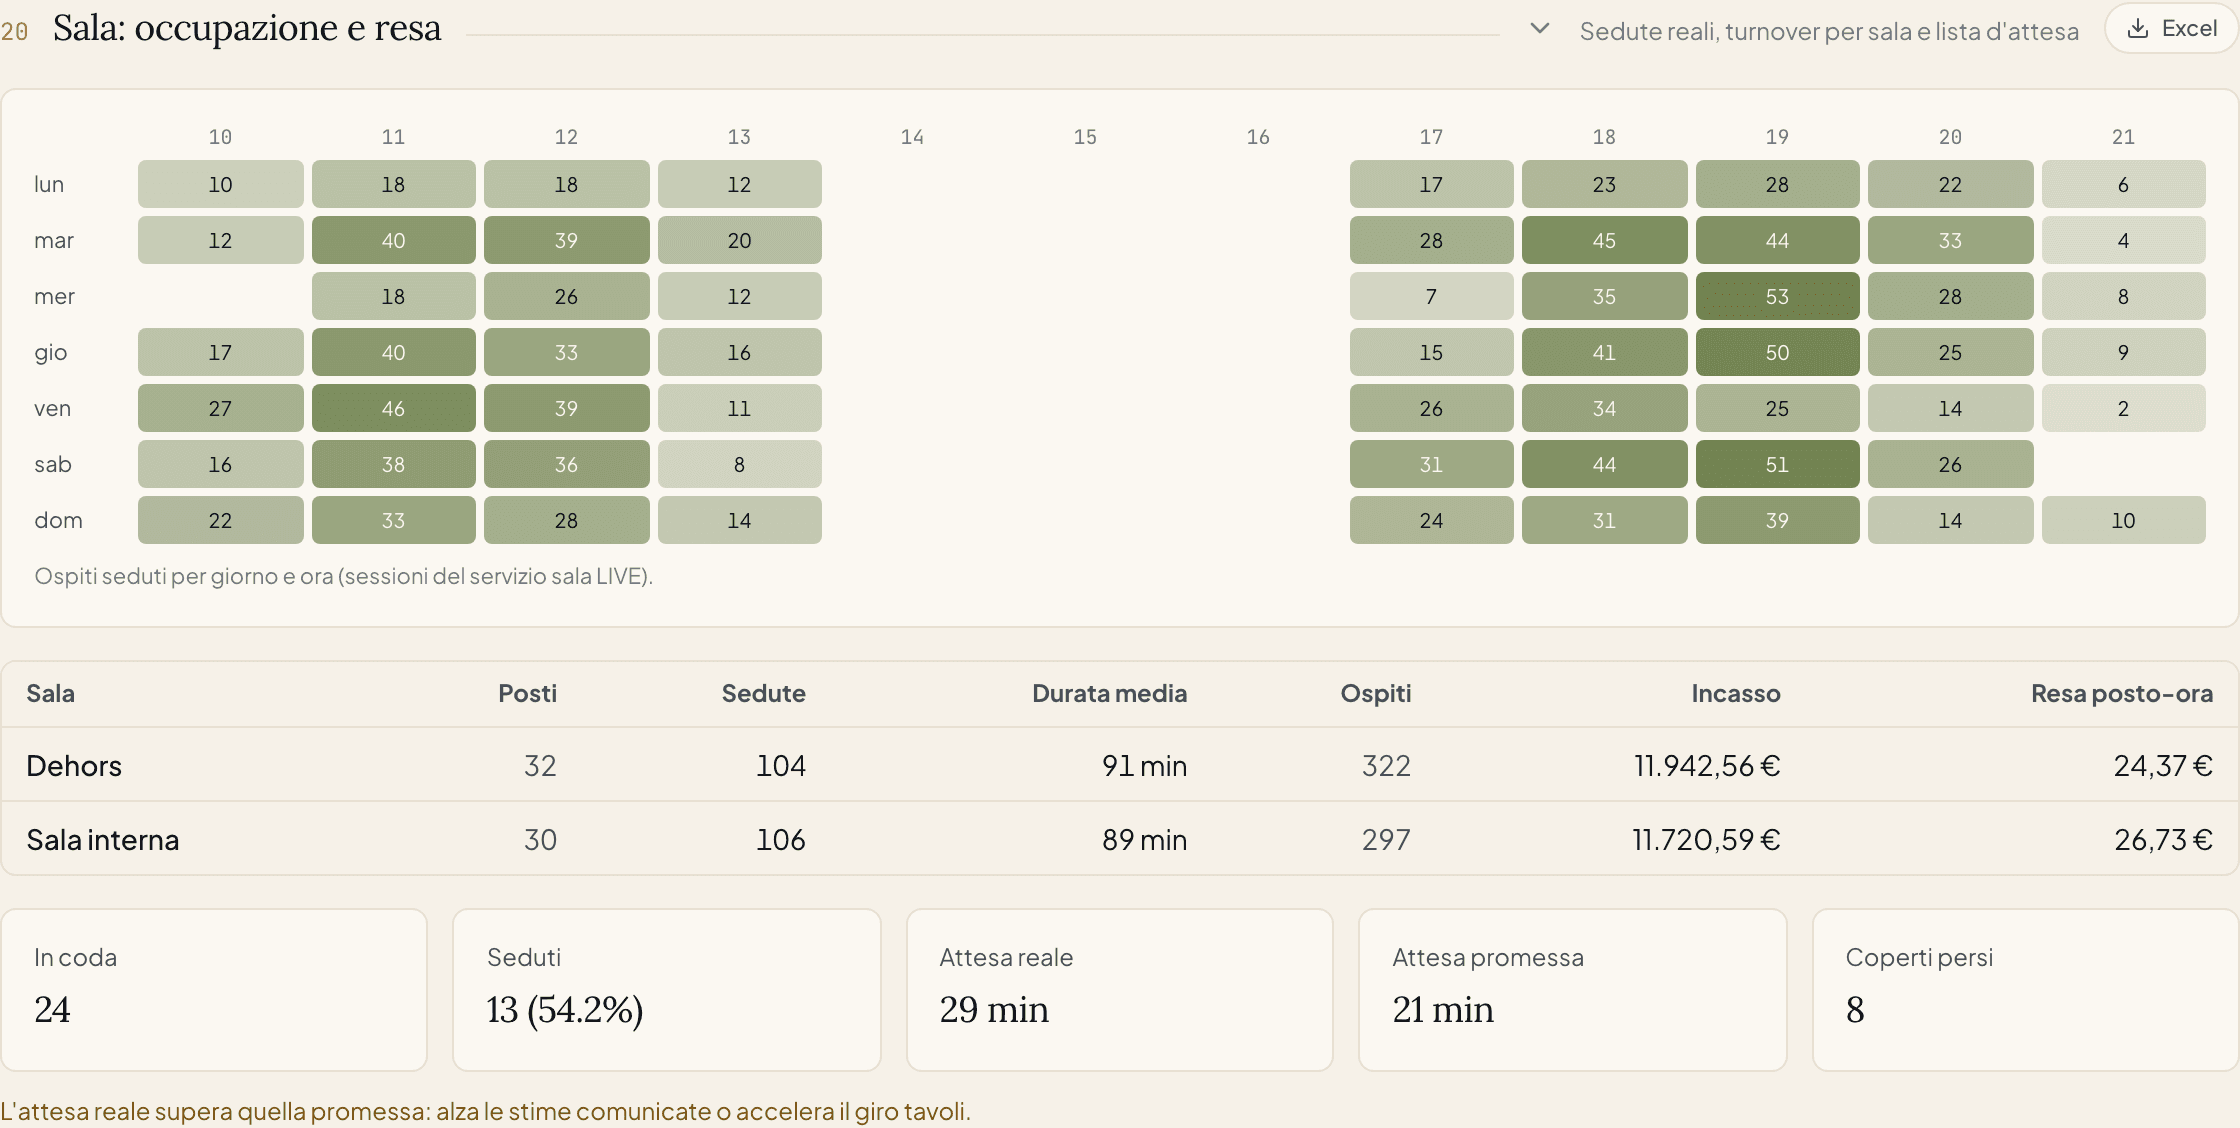
Available from Ristorante onward (requires the Table Manager, which generates the sitting data).
Anomalies
When a number moves in an anomalous way compared to the average (e.g. "Clicks on Starters −28% compared to the average"), you find it here. The calculation runs every night.
Insights for chains — from Insegna
Everything in Ristorante, plus the tools for multiple locations and the forecasts.
Customer segments
Carteia divides your customers into 6 groups based on when they last came, how often, and how much they spend: Champions, Loyal, Promising, New, At risk, Lost. It updates on its own every night.
14-day forecasts
An estimate of visits and bookings for the next 14 days, based on the trend by day of the week.
Comparison with similar venues (anonymous)
You compare yourself with venues of the same cuisine, city, and price range. It is only if you consent and stays anonymous: if there are fewer than 20 venues in the group, we show nothing.
Comparison between your locations
If you manage multiple venues, a table compares them: visits, CTR, bookings.
Loyalty program engagement
In the Loyalty page you find the pulse of the program over the last 30 days: active members, dormant ones (points on balance but inactive for 60 days), points accumulated and redeemed, redemption rate, and average time to redemption. It is included from Insegna onward (the plans with loyalty).
Costs in credits
Almost everything is included in the plan and free to consult. The only pay-as-you-go item on this page is the AI brief when you exceed the 2 free ones for the month.
| Feature | Included in plans | Credit cost per extra generation |
|---|---|---|
| 7-day snapshot | All plans | 0 |
| Menu searches / public engagement | Bistro onward | 0 |
| Period comparison / top dishes / languages | Bistro onward | 0 |
| Dish matrix / combos | Ristorante onward | 0 |
| View → order conversion | Ristorante onward (+ orders add-on) | 0 |
| Booking channels / event funnel | Ristorante onward | 0 |
| Dining room: occupancy / revenue per seat hour / waitlist | Ristorante onward | 0 |
| Weekly AI brief | Ristorante onward (2 free/month) | 5 |
| Customer segments / forecasts / comparisons | Insegna onward | 0 |
Menu statistics, marketing statistics: do not confuse them
In the dashboard there are three places with numbers. This guide covers the first one:
- Statistics (
/dashboard/analytics) — what this guide is about: menu, orders, bookings, dining room, forecasts. - Marketing AI Insights (in Marketing) — advice written by the AI on your campaigns. They unlock from Insegna onward, and each consultation, beyond the free ones for the month, costs Senza costo aggiuntivo. Details in the Marketing guide.
- Campaign statistics (in Marketing) — the results of the emails and messages sent. These too from Insegna onward.
Privacy: all cookie-free
Menu statistics are cookie-free: we measure anonymous, aggregated events, without identifying the individual person. The new public page signals (searches, filters, QR scans) are anonymous too: the search text is normalized and truncated, the session identifier is volatile (per browser tab), and no IP or user-agent ends up in the database. So:
- In line with GDPR and ePrivacy, without asking for consent for your own numbers.
- No annoying banner that disturbs the customer while looking at the menu.
- It works even with the cookie blockers of Safari and Chrome.
The most sensitive data (customer segments, anomalies, briefs) stays yours alone: each venue sees its own. The comparison with similar venues always passes through the 20-venue threshold.
Where the public page data comes from
Many of the new statistics come from what customers do on their phones, on your page and on your menu: they search for a dish, activate an allergen filter, switch language, scan a QR. It is the customer side that feeds, anonymously, the engagement cards.
Next steps
- Revenue per seat hour (RevPOSH) — the deep dive on the most important KPI of the dining room.
- Table management — the LIVE service that generates the occupancy and revenue data.
- QR table orders — unlocks the view→order conversion and the extended order analytics.
- Food cost — to have the dish matrix complete on margin too.
- Plans and credits — the details on credits and limits.
Frequently Asked Questions
- Does Carteia put tracking cookies in the menu?
- No. Menu statistics are cookie-free: we measure anonymous, aggregated events. No aggressive banner for your customers, and no consent required to see your own data in the dashboard.
- How much does the AI brief cost?
- You get 2 free briefs per month from the Ristorante plan onward. Each additional brief costs 5 credits. Briefs already generated remain available to read for free.
- What is 'revenue per seat hour'?
- It is how much you earn on average from each seat while it is occupied (revenue divided by the actual covers for the duration of the sitting). It is the cousin of the restaurant industry's RevPASH. We explain it thoroughly in the dedicated guide.
- Where do the customer searches come from?
- From the search bar of your public menu. We record the searched text anonymously, including searches that find nothing: that is 'unmet demand'.
Version history
v4.0.02026-06-12— Integrate le nuove statistiche di crescita: ricerche nel menu e engagement pubblico (Bistro+); conversione vista→ordine, canali di prenotazione, funnel eventi privati e sala (occupazione, resa posto-ora, lista d'attesa) da Ristorante in poi. Aggiunta la guida di approfondimento sulla resa posto-ora (RevPOSH/RevPASH). Doppia lettura per ogni metrica: ristoratore 'di fretta' e ristoratore 'analitico'.v3.0.02026-05-29— Corretto il costo del brief AI (5 crediti). Aggiunti i piani Osteria e Insegna Plus. Rimossa la sezione 'esportazione dati' che non corrispondeva alla funzione reale.v2.0.02026-05-20— Aggiunti gli insights di seconda generazione: matrice menu engineering, brief AI, segmenti RFM, previsioni, anomalie, salute operativa.v1.0.02025-11-10— Prima pubblicazione.